Shap Around How To Buy Into This Years Baseball Breakouts
Author: Andrew Scheiner
🛒 ‘SHAP’ Around: How to Buy into This Year’s Baseball Breakouts
(Audience: Sports fans, fantasy sports enthusiasts, aspiring data scientists; but of course, everyone is encouraged to give this article a shot!)
For those who have ever played in a fantasy sports league, one of the most exhilirating events is the draft. Every league has one! Draft day determines the core of your fantasy team and sets the tone for your sports season. While drafting can be super fun, it can also be incredibly difficult. Which players should you take? Who should you avoid? What happens if one position only has 5 or 6 good players and they are all taken…what do you do from here? Well, luckily, using machine learning, we can come up with a better idea as to which players are more likely to succeed and breakout during the season. Every draft “expert” loves to talk about breakout or sleeper candidates. These are players who have not yet had excellent seasons, but have the underlying metrics (not seen in boxscore stats) that lead us to believe they will have productive fantasy seasons. So how do we detect these players?
Introducing SHAP for Fantasy Sports
In this article, I will be introducing Shapley Additive Explanations, aka SHAP, a method for analyzing machine learning models (1). SHAP looks at the output of a model and explains which predictors, or in sports terms - underlying stats and metrics, contribute the most to a player’s fantasy performance. Our goal as fantasy sports team managers is to find players who will score the most fantasy points. To do so, we need to find metrics which will help us achieve this goal. To do this as a human requires an argumentative-minded focus.
An example of an underlying metric (a predictor) for a baseball player would be the percent of times they hit the ball hard. From an outside perspective, if a player is often hitting a ball hard, we would assume they are putting the ball in play and those plays are tough for the defensive to make. In turn, we can make a rough draft argument:
Higher hard hit ball percentage
⇓
More balls in play + the defense will have a harder time fielding the ball
⇓
More hits
⇓
More fantasy points! (This is the goal)
Using this example, we, as humans, can visually create our own idea of which predictors might positively or negatively affect the amount of fantasy points a player gets. However, for a computer, and more so a machine learning model, it uses lots of mathematics to create equations, calculate metric relationships, and generate output, which we call predictions. This is where SHAP helps us. SHAP uses the human-style argumentative approach I defined above, looks at every baseball metric we give it, and determines which are the most important for predicting fantasy points. We might be able to use logic to explain how hard hit percentage can increase fantasy points, but SHAP can statistically prove (or disprove) this for us.
Reminder: When drafting fantasy teams, we must take an empirical approach. Being empirical means we can only use past experience as knowledge. Thus, we only know how good a player has performed based on recorded performance. To predict how well a player might do in the upcoming season, we must find a way to analyze prior performance and use our findings to our benefit.
Preparing out Machine Learning Model
In order to use SHAP, we must first have a machine learning model to analyze. For this article, and for my research in finding baseball breakout candidates, I will be training a LightGBM model (2). Here is the process for developing the model:
- Collect all MLB hitters data from 2021-2025 using pybaseball to scrape data from Fangraphs.
- Create our target variable: Fantasy Points. This is the value we want our model to predict for the 2026 season.
- List all predictors we want our model to incorporate in its decisions. (3)
- Add the following fantasy points metrics to our fantasy data for our model:
- FantasyPoints_t+1 = each player’s row of stats from 2021-24 will have a value for how well the player did the next season.
- Example: Model will include Corbin Carroll’s 2023 fantasy points when analyzing his 2022 advanced stats.
- FantasyPoints_DELTA = the difference in a player’s fantasy performance over back-to-back seasons.
- This is our target variable, aka what our machine learning will be predicting. To find breakouts, we want to predict which players will have the biggest jump in fantasy points.
- Train our model with 80% of the data, test with 20% of the data. (4)
A Player Improved from 2021 to 2022. What does SHAP have to say?
Let’s use Jose Ramirez of the Cleveland Guardians for our individual player example. From 2021 to 2022, Jose improved by about 28.5 fantasy points (5). Thus, his FantasyPoints_DELTA was 28.5. Using a waterfall plot, we can dive deeper to see which of Jose’s advanced hitting stats contributed most to the change in his fantasy points from 2021 to 2022.
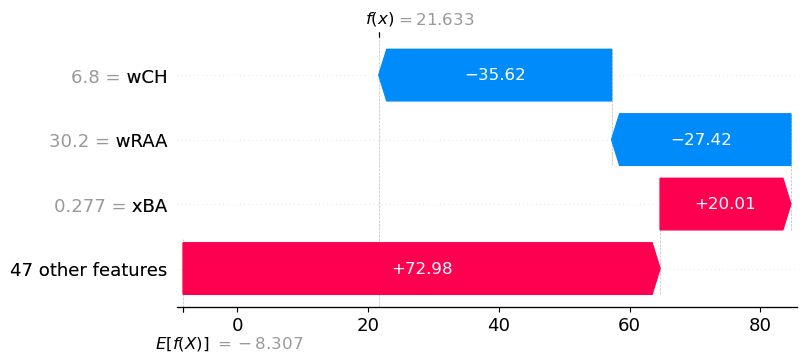
Here is how we interpret the waterfall plot:
- The average FantasyPoints_DELTA for all qualified hitters from 2021-25 that we trained our model on was E[F(X)] = -8.3 fantasy points. This means, on average, players’ fantasy output decreased by -8.3 points season over season.
- Our model predicted that Jose Ramirez would increase his fantasy performance by f(x) = 21.6 points from 2021-22.
- Looking at the stat expected batting average, xBA, we can Jose Ramirez had a 0.277 xBA in 2021. This contributed a positive +20 point increase in his fantasy point bump from 2021 to 2022.
- However, we can see he had a wCH value of 6.8. This contributed in a -35.62 fantasy point decrease from 2021 to 2022.
- Looking at the 50 predictors that SHAP used to explain our model, each SHAP value contribution evens out to give us the model’s prediction of FantasyPoints_DELTA = 21.6.
Using SHAP to Predict Breakouts for 2026
Now, for our goal: which players are poised to breakout in 2026? For my own fantasy success purposes, I will not be sharing my analysis on every player. However, I will preview certain players who I am very excited about this season. To accomplish this analysis, we will need to create a custom score to measure the chance of having a massive 2026. We will call this “SHAP Score”. In our final output, I want to know a player’s: SHAP score, percentile among all other hitters, and fantasy points from the previous season.
Technical
To create our SHAP score, we will be converting each underlying metric into a “mean absolute value” which means, for every value for a given baseball stat we are measuring, what is the mean absolute importance to our model’s predictions? This will give us a positive value for each predictor based on how heavy it contributed to our model. Then, for each feature, we will multiple a player’s 2025 advanced stat with the mean absolute value. For example, if Aaron Judge had a 0.330 xBA in 2025, if xBA had a mean absolute value of 10.0, we would add 0.330 x 10.0 = 33.0 to Aaron Judge’s SHAP score. We use a dot matrix to calculate
SHAP Score = SUM(feature_value[i] + mean_absolute_value[i]),
where i = each feature from the first feature (i=1) to the last (i=n, n = number of features)
Now that we have created a SHAP score for each player, we will convert these to percentiles to rank the players. Here is the distribution of SHAP scores:
Mean SHAP Score: 1336.82
Standard Deviation of SHAP Score: 446.99
Percentiles of SHAP Score:
10th percentile: 869.06
25th percentile: 1016.63
50th percentile: 1243.23
75th percentile: 1605.01
90th percentile: 1922.37
95th percentile: 2142.13
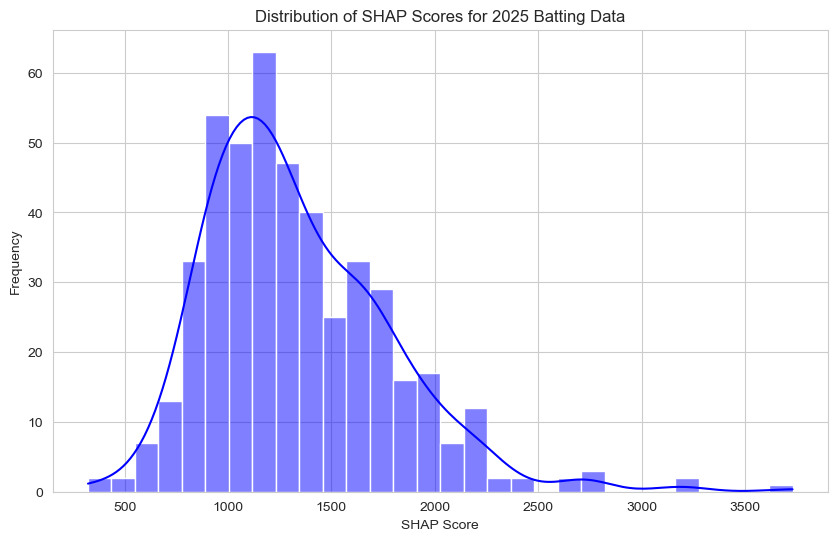
This bar graph shows us that the distribution of SHAP scores for our 2025 hitters is roughly symmetrical, however, generally skewed to the right. The minimum SHAP score is around 250 while the maximum SHAP score is around 3750 (which is a whole 1600 points higher than the 95th percentile!).
Additionally, let’s quickly view how SHAP scores correlate with Fantasy Points for the 2025 season.
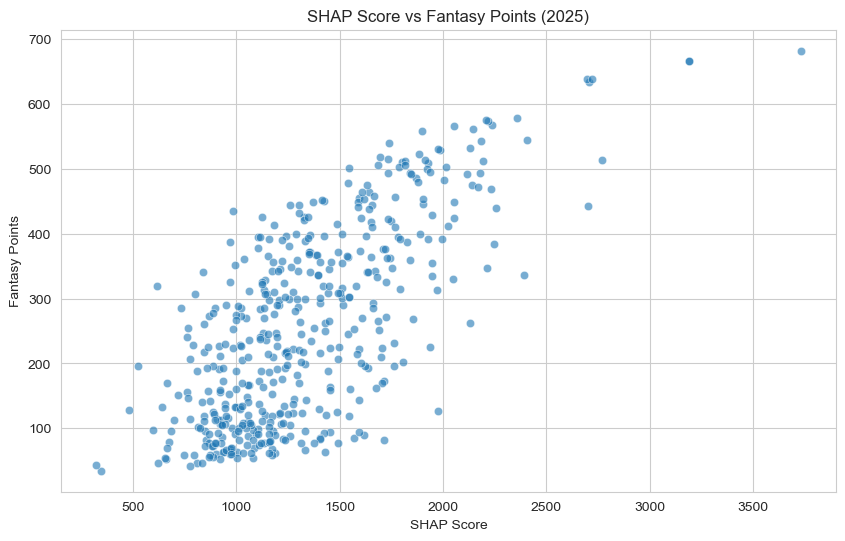
From this scatterplot, we can see there is a strong, positive, and linear association between SHAP score and Fantasy Points. This is a great sign for us. It is crucial to know that SHAP score is a close indicator for how well a player will perform in that season.
2026 Player Previews
Now what you all have been waiting for! Here are some findings from my SHAP score for 2026.
Top 10 Players by SHAP Score
| Rank | Name | Age | STD_POS | SHAP_Score | PCTile | FP2025 |
|---|---|---|---|---|---|---|
| 1 | Aaron Judge | 34 | OF | 3730 | 100 | 682 |
| 2 | Shohei Ohtani | 31 | DH | 3188 | 100 | 665.5 |
| 3 | George Springer | 36 | OF | 2768 | 99 | 514 |
| 4 | Kyle Schwarber | 33 | DH | 2722 | 99 | 638 |
| 5 | Cal Raleigh | 29 | C | 2708 | 99 | 634.5 |
| 6 | Nick Kurtz | 23 | 1B | 2703 | 99 | 443 |
| 7 | Juan Soto | 27 | OF | 2698 | 98 | 639 |
| 8 | Corbin Carroll | 25 | OF | 2408 | 98 | 544 |
| 9 | Ronald Acuna Jr. | 28 | OF | 2393 | 98 | 336.5 |
| 10 | Geraldo Perdomo | 26 | SS | 2358 | 98 | 578 |
George Springer still has some life left in him even going into his age 36-37 season while younger studs Nick Kurtz and Geraldo Perdomo seem poised to build on their impressive 2025 campaigns.
Breakout Candidates
| Name | Age | STD_POS | SHAP_Score | PCTile | FP2025 |
|---|---|---|---|---|---|
| Ivan Herrera | 26 | C | 1949 | 92 | 355 |
| Ben Rice | 27 | C | 1927 | 90 | 392 |
| Drake Baldwin | 25 | C | 1752 | 84 | 347 |
| Kyle Teel | 24 | C | 1700 | 81 | 210.5 |
| Michael Busch | 28 | 1B | 2170 | 95 | 472.5 |
| Jonathan Aranda | 28 | 1B | 2047 | 94 | 329.5 |
| Luke Keaschall | 23 | 2B | 1714 | 82 | 172.5 |
| Junior Caminero | 22 | 3B | 1987 | 92 | 529.5 |
| Colson Montgomery | 24 | SS | 1762 | 85 | 232 |
| Kyle Stowers | 28 | OF | 2247 | 97 | 383.5 |
| Jakob Marsee | 25 | OF | 1761 | 85 | 195.5 |
These are players with lower fantasy points from last season, but high SHAP scores. Yankees catcher/first baseman Ben Rice is the perfect example of a player who got incredibly unlucky last year with fantasy output but has all of the right underlying metrics to set himself up for success in 2026.
Regression Candidates
| Name | Age | STD_POS | SHAP_Score | PCTile | FP2025 |
|---|---|---|---|---|---|
| Agustin Ramirez | 24 | C | 1157 | 40 | 391.5 |
| Yainer Diaz | 27 | C | 1155 | 39 | 366 |
| Ozzie Albies | 29 | 2B | 1124 | 36 | 426 |
| Otto Lopez | 27 | 2B | 1108 | 33 | 395.5 |
| Matt McLain | 26 | 2B | 994 | 23 | 351.5 |
| Josh Jung | 28 | 3B | 1124 | 35 | 325.5 |
| Anthony Volpe | 25 | SS | 970 | 20 | 386.5 |
| Michael Harris II | 25 | OF | 985 | 22 | 435 |
While I obviously want to see all baseball hitters succeed (especially one of my favorite currently players who falls on this list, Rangers third baseman Josh Jung), it is always important to highlight players to caution drafting and picking up. These regression candidates all scored over 300 fantasy points in 2025, but have lower than a 50th percentile SHAP score, meaning their underlying metrics do not indicate future success.
Wrapping Up
While SHAP might not be as well known or fancy as a neural network, or an LLM model like ChatGPT, it makes the process of truly understanding our machine learning output so much easier. It’s fascinating how we can truly take a deeper look into the number our computers are constantly churning to ask: where do our predictions come from? SHAP helps us answer that question using visuals that not many other options out there can. As someone who has been following fantasy sports since back when Ken Griffey Jr. was still on the Reds (granted it was his last few seasons), I am extremely excited to share my findings with you all and hopefully show how data science can make baseball (and all sports) incredibly entertaining. Thank you so much for reading.
Appendix
(1) Machine learning is a technique used by data scientists to train computers on collected data to make predictions about the unknown.
(2) LightGBM is a gradient-boosted decision tree. A decision tree is essentially a sequence of questions that help us make a decision about features of our model. We can implement LightGBM using the lightbgm Python package, which utilizes a scikit-learn styled API.
(3) All predictors I use:
[
    "BB%", "K%", "OBP", "SLG", "OPS", "ISO", "BABIP", "GB/FB", "LD%", "GB%", "FB%",
    "IFFB%", "HR/FB", "IFH%", "BUH%", "wOBA", "wRAA", "wRC+", "wFB", "wSL", "wCT", "wCB", "wCH",
    "wSF", "O-Swing%", "Z-Swing%", "Swing%", "O-Contact%", "Z-Contact%", "Contact%",
    "Zone%", "F-Strike%", "SwStr%", "BsR", "Pull%", "Cent%", "Oppo%", "Soft%", "Med%", "Hard%",
    "EV", "LA", "Barrel%", "maxEV", "HardHit%", "CStr%", "CSW%", "xBA",
    "xSLG", "xwOBA"
]
(4) LightGBM model definition
model = lgb.LGBMRegressor(
    n_estimators=500, #number of small trees
    learning_rate=0.03, #small corrections
    max_depth=-1, #no limit on tree depth
    subsample=0.8, #randomly sample 80% of the data for each tree
    colsample_bytree=0.8 #randomly sample 80% of the features for each tree
)
(5) The fantasy points calculation I use is:
batting["FantasyPoints"] = 1.5*batting["SB"] + 3*batting["3B"] + 1.5*batting["1B"] + \
                            2*batting["2B"] + 4*batting["HR"] + 1*batting["BB"] + \
                            1*batting["RBI"] + 1*batting["HBP"]
which ignores batter strikeouts.